The dashboard
Chatbot in the admin menu opens the dashboard:
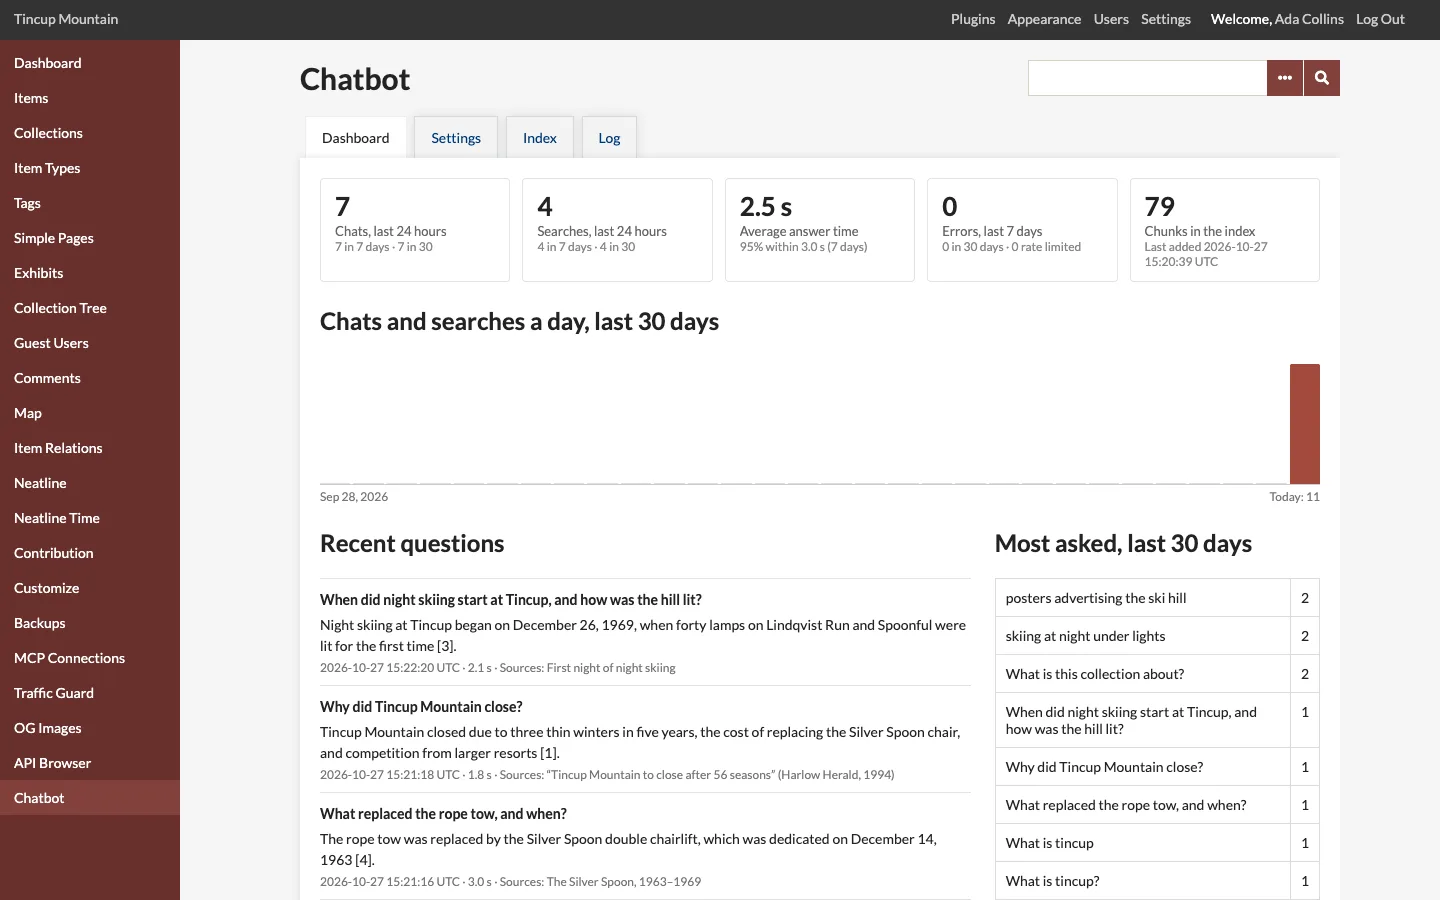
- Chats and searches in the last 24 hours, 7 and 30 days.
- Average answer time over the last 7 days, and the time within which 95% of answers came.
- Errors in the last 7 and 30 days, and how many requests were refused by the rate limit.
- Chunks in the index, and when the last one was added.
- A chart of chats and searches a day over the last 30 days.
- Recent questions: the last 20 questions with their answers, sources and times.
- Most asked: the questions and searches asked most in 30 days.
- Events: every kind of event in the log over 30 days, with its count.
The dashboard counts from the log: with What to log set to warnings or errors only, it has no chats or searches to count.
The log
Chatbot > Log lists every event, newest first, 50 a page, with its level, its name and its message; Details shows what was recorded with it (for chats: the question, the answer, the sources and the times).
| Event | When |
|---|---|
chat.complete, chat.search |
A chat was answered (and its search). |
semantic_search |
A search. |
index.item, index.file, … |
A record was indexed. |
index.skip |
A record was not indexed: not public, outside the collections indexed, or without text. |
bulk.start, bulk.done, queue.done |
Re-indexing and the indexing job. |
prune.done |
Non-public chunks were removed. |
chat.error, search.error, index.error, queue.error |
Something failed: the message says what (OpenAI, Turso, a missing key). |
chat.rate_limit, search.rate_limit |
A visitor went over the rate limit. |
Show only errors, warnings, info or debug entries with Show. Download as CSV exports the entries shown, with the question, answer, number of sources and time of each chat in their own columns, in the site's time zone (UTF-8, for Excel too). Delete entries older than … days applies the retention period now; it also runs once a day by itself.
Times are stored in UTC and shown in the server's time zone.