Go to Traffic Guard in the admin menu.
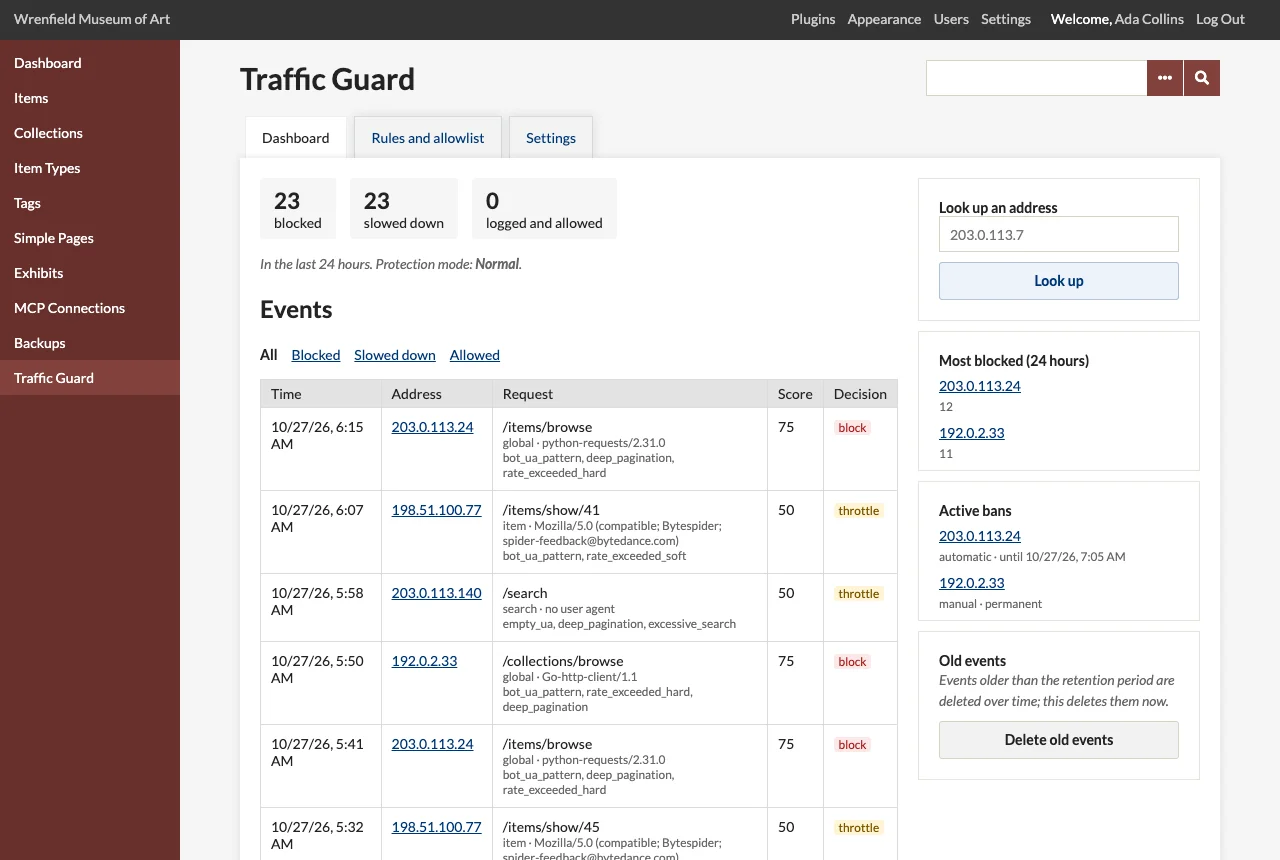
The last 24 hours
The top of the dashboard counts the requests that were blocked (403), slowed down (429) and, when Log allowed requests is on, logged and allowed, in the last 24 hours, and shows the protection mode.
Events
The event log lists every slowed-down and blocked request, newest first, with:
- the time and the address (click it for the address's history);
- the path, the kind of page (
global,search,item,api,mcp, orbannedfor a request from a banned address) and the user agent; - the signals that raised its score (see Risk Scoring);
- the score and the decision.
Filter it with Blocked, Slowed down or Allowed.
An address's history
Click an address, or enter one under Look up an address, to see:
- whether it is banned or allowlisted;
- every ban it has had, who placed it and why;
- its last hundred logged requests;
- its request counts in the current and recent windows.
Super Users can ban it from there (see Managing Bans).
Most blocked and active bans
The side panels list the ten addresses blocked most often in the last 24 hours and the bans in force, automatic or manual.